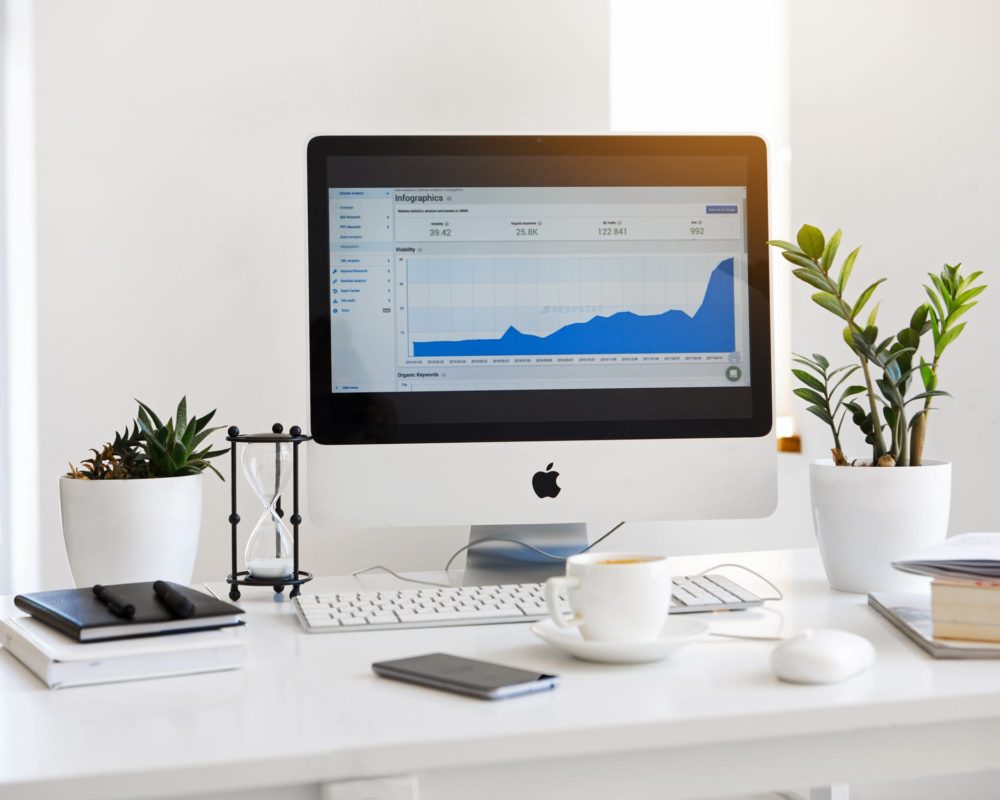
A dashboard is a collection of charts that display important information in regards to your business. Like a dashboard in your car, a digital dashboard can provide a top level overview of your key data points. Designed to be an summary rather than a ‘silver bullet’, an automated dashboard cuts the time to investigation and insight whilst taking emphasis off manual reporting.
How dashboards save time?
By having all key statistics about a website and digital marketing appear at a glance, users can quickly notice if any relevant changes have occurred and react accordingly. Reaction time would be far slower if analysts and marketing managers had to download and manipulate the data manually or inspect each database separately. Copying data and preparing business reports can also be done much faster when all tools can be accessed from the dashboard, allowing the analytics team to complete more work with the same number of people.
Why is data integration important?
One of the primary reasons why multiple software manufacturers have adopted the dashboard concept is the ability to integrate diverse data without the need for a database or a developer. For example, you can track performance of social media pages in conjunction with conversion figures for a related set of Google Ads in the same overall campaign. Marketing managers can see the big picture only by combining data from many different platforms, and dashboards make this task much easier.
Can dashboards be personalised?
In a word, yes. While the exact personalisation options may vary from one software suite to another, in general users are allowed to organise space on the page as they see fit. It’s possible to import data from any offline or online source, set up reminders and automate report generation, to name just a few common features. Arranging the dashboard to display the most important bits of data in most prominent places is one of the key skills for every digital marketer. Branding is also important, with most tools providing complete control over logos, imagery and colour schemes.
Does it take long to learn how to use a dashboard?
Most dashboards are designed to be user-friendly and rely on visual language to soften the shock of having to deal with and interpret so many metrics at once. Dashboards, by design, should be succinct and clear. Again, there is a reason why this interface format has been accepted as the industry standard, and it won’t take long for every new analytics practitioner to discover it.
How can I create a dashboard?
Some of the most popular dashboard tools are Google Data Studio, Microsoft Power BI, Tableau and Qlik.


